Rate limits
Application Collection applies rate limits to certain operations. These limits help us maintain a proper service level by guaranteeing that every customer conforms to a usage quota.
At the moment, pulling content from the Distribution Platform is the only operation which is subject of a rate limit. The exact rate limit applied depends on your subscription and is different for user accounts and service accounts. You can find more information and the exact values in the Subscriptions page.
Understanding rate limits
Understanding how rate limits work helps you manage your and your organization’s usage efficiently.
There are two main concepts involved when applying rate limits:
- Time window: Rate limit policies limit the number of acceptable requests in a given time window. This time window is usually defined in seconds.
- Request quota: The request quota is the maximum number of requests that the server is willing to accept from one or more clients on a given basis (originating IP, authenticated user…) during the defined time window.
Time window
In Application Collection, the default time window is set to 24 hours (86.400 seconds). This time window is calculated using a rolling window algorithm.
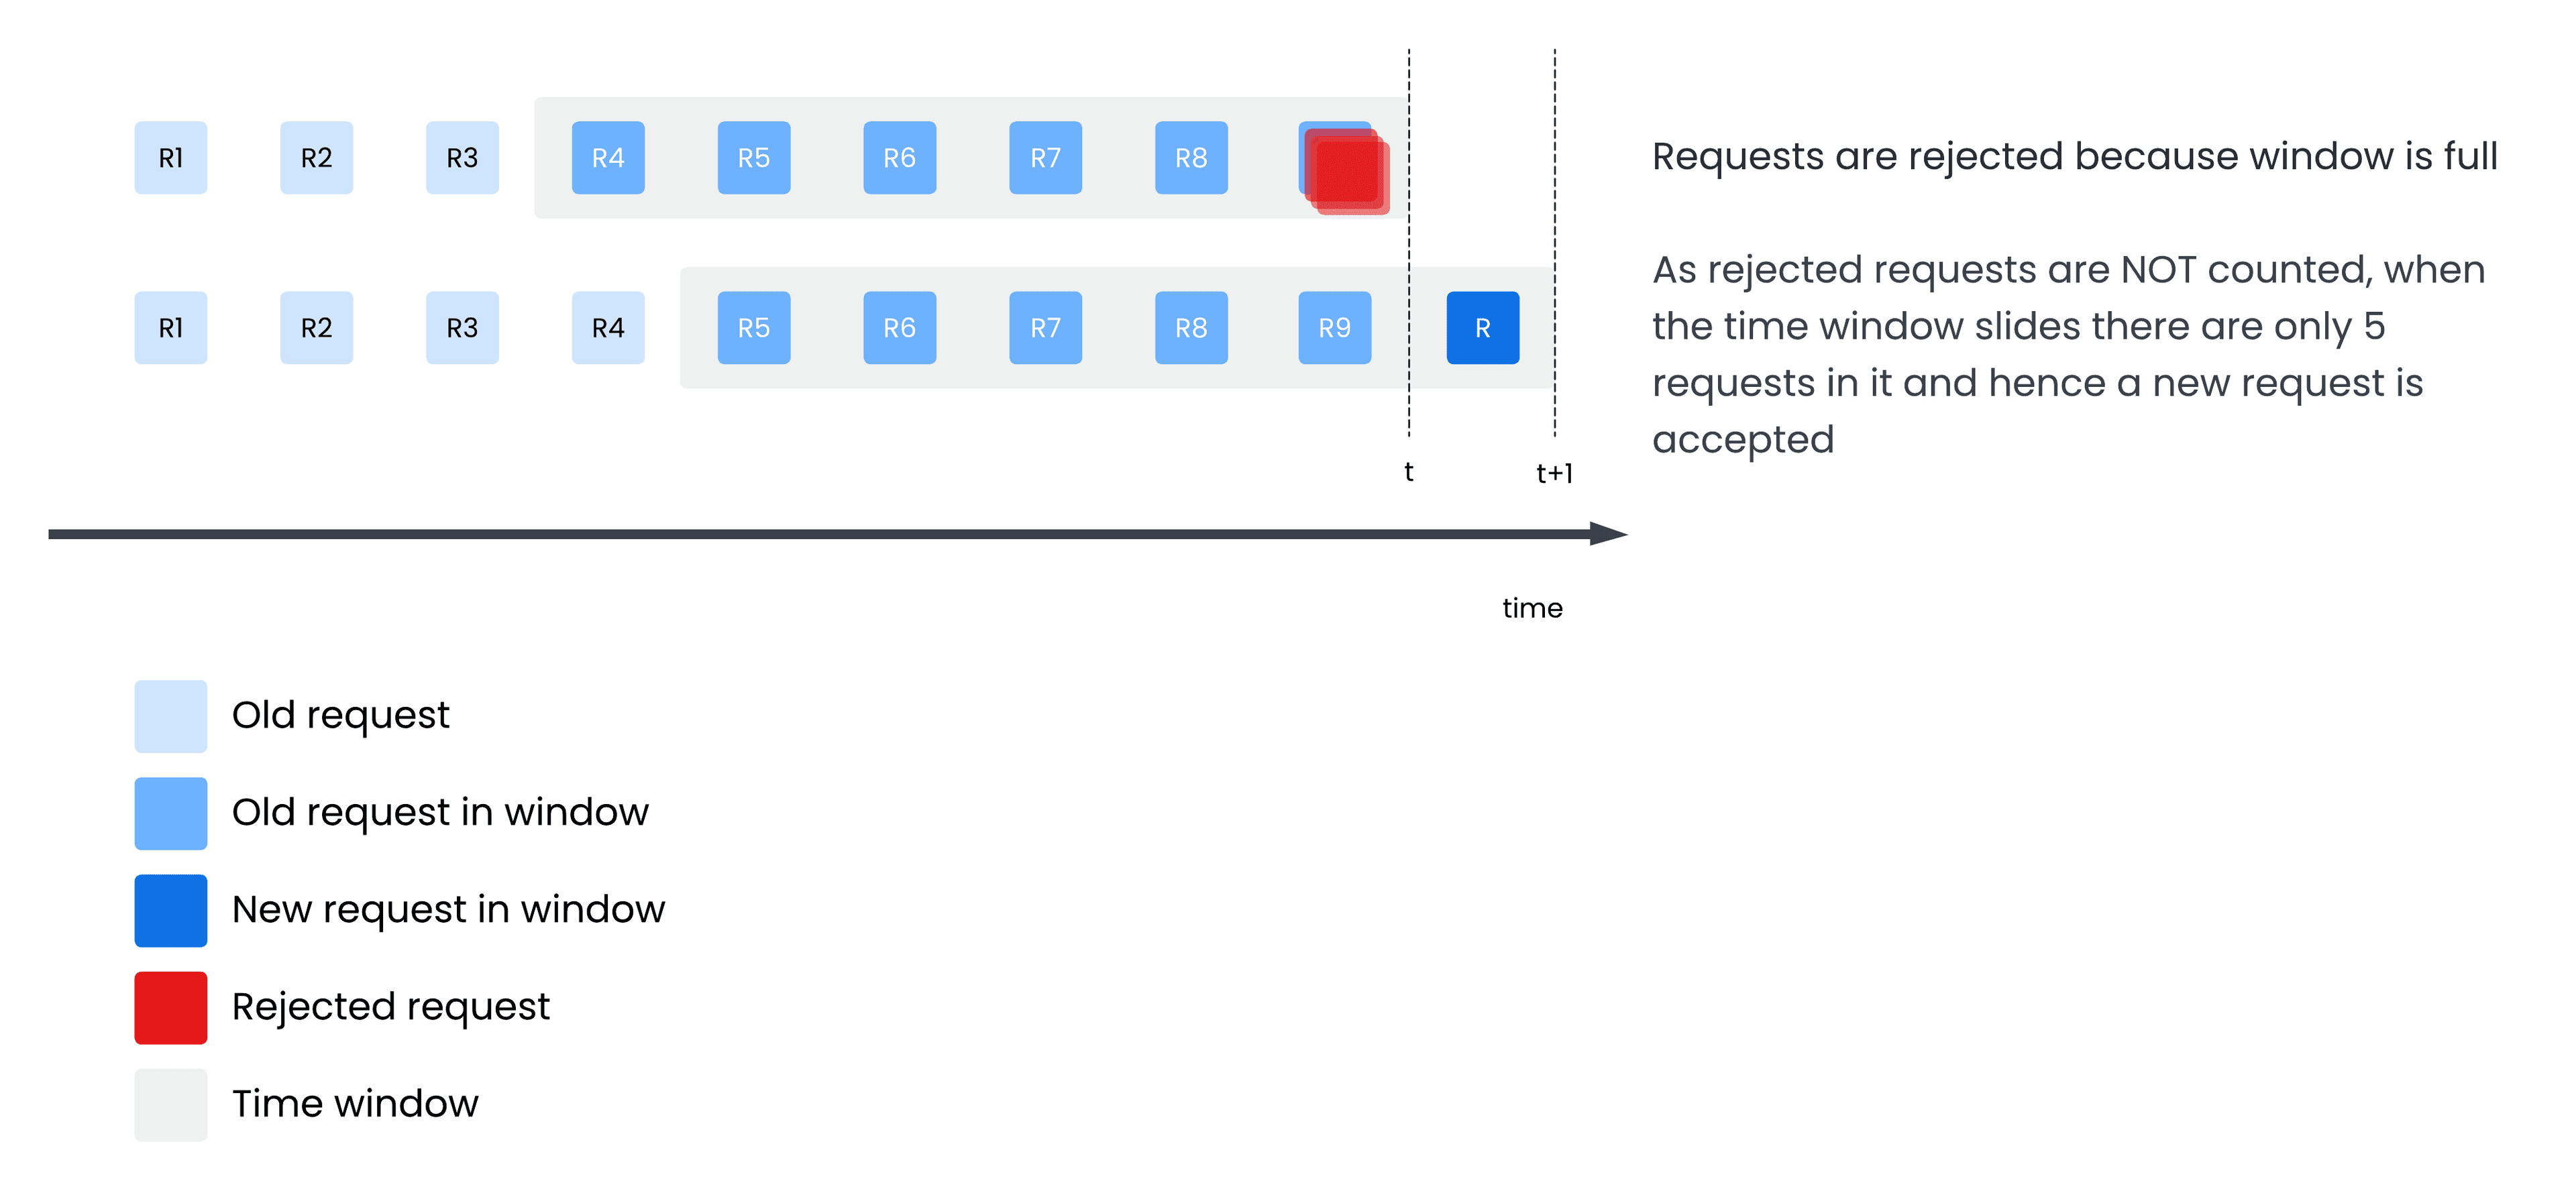
The rolling window rate-limiting algorithm is based on a dynamic time window that moves with time, allowing for more flexibility in managing bursts of traffic.
The following illustration depicts how the rolling window algorithm is used to calculate whether new requests are accepted or rejected.

Request quota
When it comes to applying the request quota, it is necessary to define how the system will handle the requests received after the rate limit has been reached.
All requests received when the rate limit is reached will not be processed and will receive a 429 TOO MANY REQUESTS response.
However, when a sliding window algorithm is used it is important to decide whether denied requests are taken into account when counting the number of requests received in the current window.
Application collection does not take into account rejected requests to calculate how many requests the user has done in the current time window. The following picture illustrates this behaviour.

Checking my rate limits
Operations which are subject to a rate limit should clearly communicate what is the rate limit being applied and what is the status of that rate limit. In this section you will learn how to check your rate limits and get information about their current status.
HTTP rate limit headers
Valid API requests to Distribution Platform include the following rate limit headers in the response:
ratelimit-limit: indicates the configured request quota for the given operation and the size of the time window (in seconds) associated to it. Example:ratelimit-limit: 50;w=21600.ratelimit-remaining: indicates the remaining quota that the user has in the current window and the time left (in seconds) to have new requests available. Example:ratelimit-remaining: 30;w=14400.
These headers are returned on both GET and HEAD requests.
It is recommended that clients pulling content from Application Collection use these headers to manage and optimize their requests efficiently.
User interface
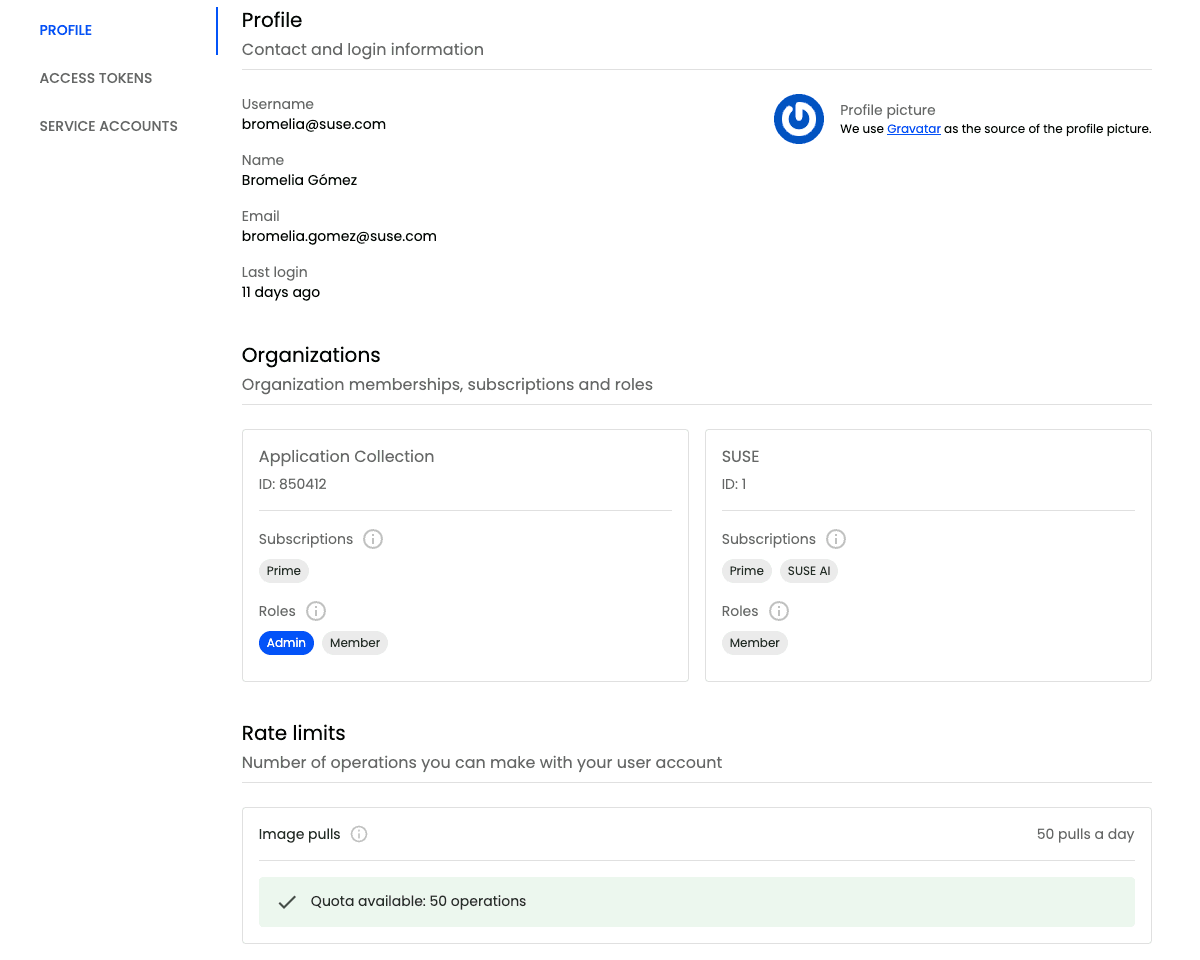
Additionally, Application Collection users can check their current rate limits statuses and quotas in their profile page in the web application.
Open the web application
Once opened it in your browser of choice, sign in.
Go to your profile settings
In the upper-right corner you will see your profile picture. Click on it and then, in the pop-up, click Settings.
Organization admins will also be able to see the rate limits applied to the service accounts of their organizations.
